
Inference Serving Monitoring Metrics That Matter for Production LLMs
Every serving team eventually builds the same dashboard twice: first as a wall of numbers nobody reads, then as the four or five metrics that actually explain user experience. The difference between the two versions is not tooling — it is knowing which metrics carry signal, what each movement means diagnostically, and how percentiles turn raw latency into decisions. The vendor references have standardized the metric names; this page assembles the operational layer they assume you already have.
Quick Answer: Which Metrics Matter for LLM Serving?
Four latency-profile metrics define health: TTFT (time to first token — the user's initial wait), TPOT/ITL (per-token pace of streaming), end-to-end latency, and throughput (tokens or requests per second). Behind them, four capacity signals explain movement: queue depth, KV cache utilization, batch occupancy, GPU state. Diagnosis is a signature read: high TTFT with normal TPOT points upstream (queueing, prefill pressure); high TPOT with normal TTFT points to decode limits (batch saturation, KV pressure); both rising means capacity exhaustion. Set SLOs at P95/P99 with error budgets, alert on budget burn, and verify with replayed traffic.
Prerequisites: The Metric Set Every Serving Stack Needs
Four latency-profile metrics define serving health: time to first token (TTFT), time per output token (TPOT) or inter-token latency (ITL), end-to-end request latency, and throughput in tokens or requests per second — the set vendor references have standardized. Around them sit the capacity signals that explain movement: queue length and wait time, KV cache utilization, batch occupancy, and GPU utilization. Collecting the four without the capacity signals is a dashboard that tells you you are slow but not why; collecting capacity without the profile is a dashboard that explains everything and proves nothing.
| Layer | Metrics | What They Prove |
|---|---|---|
| Latency profile | TTFT, TPOT/ITL, end-to-end, throughput | The experience users receive |
| Capacity signals | Queue depth, KV utilization, batch occupancy, GPU state | Why the profile moved |
The naming is standardized even where implementations differ: NVIDIA's benchmarking reference defines TTFT, TPOT, ITL, and throughput for inference performance, and Anyscale's serving documentation treats the same set as the optimization target. The reason this particular quartet won is that it splits perceived latency at its natural joint — TTFT is the wait before anything appears, TPOT is the pace after — and every serving decision (batching, admission, memory) moves one half more than the other, which is what makes diagnosis possible.
The Build: Dashboard Layers and the Diagnostic Map
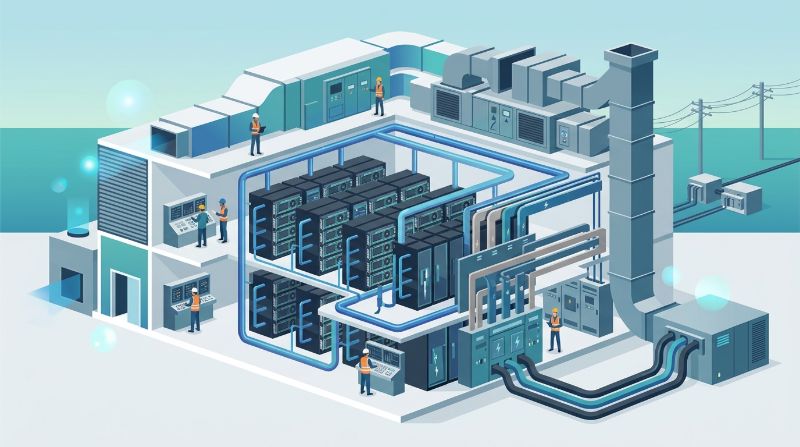
Build in three layers: the user layer (TTFT and TPOT percentiles against SLO), the workload layer (throughput, request mix, concurrency), and the infrastructure layer (queue depth, KV utilization, GPU state). Then wire the diagnostic map: high TTFT with normal TPOT points upstream — queueing, prefill pressure, or admission control; high TPOT with normal TTFT points to decode-side limits — batch saturation, memory pressure on KV, or thermal throttling; both rising together points to capacity exhaustion, where the serving tier needs more memory or more replicas rather than configuration tuning. The map converts a slow-page alert into a directed investigation in one glance.
| Signature | Points To | First Move |
|---|---|---|
| High TTFT, normal TPOT | Queueing or prefill pressure | Check queue depth and admission settings |
| Normal TTFT, high TPOT | Decode-side limits | Check batch occupancy and KV utilization |
| Both rising | Capacity exhaustion | Add memory or replicas, not tuning |
| Throughput flat, latency up | Saturation knee crossed | Cut load or expand before the tail breaks |
The signature table is the dashboard's operating manual: post it next to the graphs, because the 3 a.m. engineer does not need to re-derive queueing theory — they need to know that TTFT-without-TPOT means upstream and act accordingly. SLO engineering practice formalizes the same thinking with latency budgets and capacity math; the map is the budget's bedside form.
Verification: SLOs, Percentiles, and Alert Design
Set SLOs at percentiles per metric — P95 or P99 for TTFT and TPOT as the user-experience boundary, with error budgets sized to the percentile — and verify with replayed traffic that the dashboard's numbers match what users experience. Alert on SLO burn (the budget depleting), not on raw threshold crossings, so a P99 excursion pages only when it matters; wire the diagnostic map into the alert payload so the on-call engineer receives the signature, not just the number. The verification loop: replay, compare dashboard percentiles to user-side measurements, and correct instrumentation gaps — a dashboard that misses the queue component understates TTFT exactly when it matters.
| Design Choice | Practice | Failure It Prevents |
|---|---|---|
| Percentile targets | P95/P99 per latency metric | Averaging away the tail users feel |
| Alerting | Burn-rate on error budgets | Pages on excursions that matter only |
| Alert payload | Signature attached, not just numbers | On-call guessing at 3 a.m. |
| Verification | Replay versus user-side reality | Instrumentation gaps misreading TTFT |
One capacity note closes the loop: when the verification shows capacity exhaustion as the recurring signature, the fix is infrastructure, not tuning — and for SLO-bound serving the determinism of the infrastructure layer decides whether your metrics mean what they say. Bare-metal serving enclaves of the kind OneSource Cloud delivers keep the GPU signals free of noisy-neighbor variance, with NVMe-oF storage tiers keeping KV refill off the latency path — the reference posture at OneSource Cloud Managed AI Infrastructure.
FAQ
Should you alert on P99 or P50 serving latency?
P99 as the alert boundary, P50 as the trend line: the median tells you the typical experience and drifts silently, while the tail is where users churn and SLOs live — alert on tail burn rate, watch the median for regressions, and investigate whenever the two diverge, because divergence means a subset of requests is failing while most look fine.
How does OneSource Cloud serve SLO-bound inference monitoring?
OneSource Cloud runs SLO-bound serving on single-tenant bare-metal enclaves where the infrastructure layer of the dashboard is deterministic — no noisy-neighbor variance polluting the GPU signals — with NVMe-oF storage tiers keeping KV refill off the latency path, so TTFT and TPOT movements reflect your workload rather than your neighbors.
Related Articles
Recommended Reading
-
How Paged Attention Manages Inference KV Cache
-
Google Cloud GPU Pricing: What Enterprise AI Teams Should Evaluate Before Provisioning
-
Paperspace Pricing 2026: GPU Cost Breakdown
-
AI Infrastructure Costs: Controlling Enterprise GPU Spending
-
CoreWeave Enterprise GPU Cloud: Evaluation for AI Teams
-
CoreWeave vs Lambda Labs: GPU Cloud Provider Comparison
-
AWS GPU Pricing: Instance Types, Cost Structure & Alternatives Guide
-
CoreWeave Alternatives: Compare GPU Clouds
latest articles
-
GPU Patching and Updates as a Managed Service for Enterprise AI
-
AI Infrastructure Incident Response for PHI Under HIPAA Timelines
-
Inference Serving Monitoring Metrics That Matter for Production LLMs
-
Network Oversubscription in AI Clusters and What It Costs Training
-
AI Training vs Inference Power Consumption for Enterprise Infrastructure
-
Preconfigured Versus Custom GPU Infrastructure TCO Compared
-
AI Dataset Authoritative Copy Governance and Shadow-Copy Risks
-
GPU Management Network Isolation Principles for AI Clusters
-
How to Test Generative AI Capacity Headroom Before Production
-
Rail-Optimized Network Architecture for Enterprise GPU Clusters