
Monitoring P95 Latency in Production LLM Deployments
Monitoring p95 latency in production LLM deployments means tracking tail latency against SLOs, correlating spikes with queue depth and KV cache pressure, and alerting on the rate of change so drift is caught before users notice slow responses. For the latency diagnosis, see what causes high p95 latency. For the monitoring framework, see token generation latency monitoring.
The Production Monitoring Setup
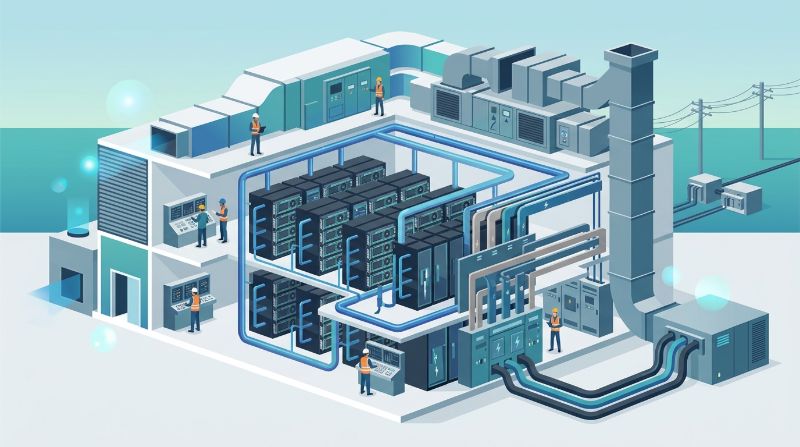
Track p95 TTFT and TPOT over rolling windows — these are the percentiles users experience. If p95 TTFT rises, first-token responsiveness is degrading. If p95 TPOT rises, generation pace is slowing. Correlate with system signals: when p95 spikes, correlate with queue depth (queue contention?), KV cache occupancy (memory pressure?), batch size (batching too large?), and GPU utilization (resource saturation?). The correlation localizes the cause. Alert on rate of change: an alert on "p95 latency rising faster than X over Y minutes" catches drift before the absolute threshold is crossed. An absolute-threshold-only alert fires after users already notice. Error budget tracking: track how fast the SLO error budget is burning. A burn rate above the acceptable pace triggers capacity or configuration changes before the SLO breaches. For the SLO framework, see meeting latency targets for LLM serving.
FAQ
How do I monitor p95 latency in production LLM deployments?
Track p95 TTFT and TPOT, correlate spikes with queue depth, KV cache, batch size, and utilization, and alert on rate of change rather than absolute thresholds. Pair with error budget tracking so SLO breaches are caught early. See above.
Summary
Production LLM p95 monitoring is tracking, correlating, and alerting on tails. For the full framework, see token generation latency monitoring.
Related Articles
Recommended Reading
-
How Paged Attention Manages Inference KV Cache
-
Google Cloud GPU Pricing: What Enterprise AI Teams Should Evaluate Before Provisioning
-
Paperspace Pricing 2026: GPU Cost Breakdown
-
AI Infrastructure Costs: Controlling Enterprise GPU Spending
-
CoreWeave Enterprise GPU Cloud: Evaluation for AI Teams
-
CoreWeave vs Lambda Labs: GPU Cloud Provider Comparison
-
AWS GPU Pricing: Instance Types, Cost Structure & Alternatives Guide
-
CoreWeave Alternatives: Compare GPU Clouds
latest articles
-
GPU Cluster Fabric: Spine-Leaf RoCE Architecture and Latency
-
AI Workload Migration From Public Cloud to Dedicated Hardware
-
GPU Cluster Orchestration: Gang Scheduling for AI Workloads
-
AI Storage Tier Design: Eliminating I/O Wait in Checkpointing
-
GPU Capacity Planning for AI Teams: Sizing Beyond Peak Load
-
AI Infrastructure BAA Audit: Cloud Provider Gaps for Healthcare
-
AI Infrastructure for Fraud Detection: Low-Latency Inference
-
AI Infrastructure Services vs Raw Cloud GPU Rental Cost
-
Fixing Memory Bandwidth Bottlenecks in Low-Utilization LLMs
-
Protecting AI Model IP With Single-Tenant GPU Isolation