
ML Storage IOPS Queue Monitoring for GPU Workloads
ML storage IOPS queue monitoring catches the storage bottlenecks that starve GPUs — when the queue depth at the storage layer grows, GPUs wait for data, and utilization drops, but the symptom looks like idle capacity rather than a storage problem. For the training monitoring framework, see AI training platform monitoring. For the storage architecture requirements, see AI storage architecture requirements.
Why Storage Queue Monitoring Matters
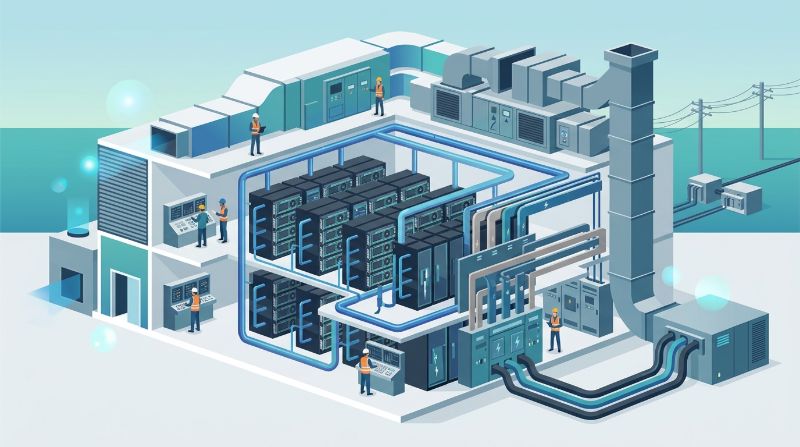
GPU clusters spend their time either computing or waiting for data. When storage cannot deliver data fast enough, GPUs idle, and the symptom — low GPU utilization — is the same as having too little work, a scheduling problem, or a network bottleneck. Storage queue monitoring isolates the cause: if the storage layer's IOPS queue depth is high and IO latency is rising, the GPUs are starved, not underworked. Catching this early prevents hours of misdiagnosis that treats a storage bottleneck as a scheduling or capacity problem.
The Signals to Monitor
Three storage signals explain whether GPUs are starved. Storage IOPS queue depth: how many I/O operations are waiting for the storage layer to process them. A growing queue means the storage cannot keep up — data is backing up, and GPUs waiting on that data are idling. Storage read latency: how long each I/O takes. Rising latency, especially under load, signals storage saturation or contention that directly extends training time. Storage throughput: the data rate the storage delivers. If throughput plateaus below what the GPUs can consume, the storage is the bottleneck. For how to design storage to prevent these signals from firing, see AI storage architecture requirements.
Correlate these with GPU utilization: if GPU utilization is low, storage queue is high, and throughput is below expectation, the storage is the bottleneck — not the scheduler, not the workload. The correlation is what turns "something is slow" into "the storage is the bottleneck." For the full correlation methodology, see AI training platform monitoring.
FAQ
How do I know if storage is starving my GPUs?
Monitor storage IOPS queue depth, read latency, and throughput alongside GPU utilization. Low GPU utilization plus high storage queue depth plus throughput below GPU consumption rate equals data starvation. The correlation of these signals isolates the bottleneck.
What storage metrics matter for GPU workloads?
IOPS queue depth (is data backing up?), read latency (how long each I/O takes, especially under load), and throughput (is the data rate meeting GPU demand?). Correlate these with GPU utilization to determine whether storage is the bottleneck. See the signals above and AI storage architecture.
Summary
ML storage IOPS queue monitoring catches the storage bottlenecks that starve GPUs by monitoring queue depth, latency, and throughput, and correlating them with GPU utilization. Data starvation looks like idle GPUs; storage signals isolate the cause. For the full monitoring framework, see AI training platform monitoring.
Related Articles
Recommended Reading
-
Google Cloud GPU Pricing: What Enterprise AI Teams Should Evaluate Before Provisioning
-
Paperspace Pricing 2026: GPU Cost Breakdown
-
CoreWeave Enterprise GPU Cloud: Evaluation for AI Teams
-
AI Infrastructure Costs: Controlling Enterprise GPU Spending
-
CoreWeave vs Lambda Labs: GPU Cloud Provider Comparison
latest articles
-
Open-Source LLM Deployment: Requirements and Real Cost Breakdown
-
AI Search Assistants Under Data Residency: Architectures and Evidence
-
LLM Inference GPUs Compared: A100, H100, H200, or B200 for Production
-
LLM Deployment Best Practices: An Enterprise Stage-by-Stage Checklist
-
HIPAA Patient Scheduling AI: Controls, Consent, and Evidence
-
Cloud-Agnostic LLM Deployment: Architecture Principles Against Lock-In
-
HIPAA-Compliant AI Tools for Healthcare: Categories and Evaluation
-
Batch vs Real-Time LLM Inference: Cost, Latency, and Fit
-
Model Deployment Strategies Compared: Canary, Blue-Green, Shadow, Rolling
-
GPU Rental vs Owning: Cost, Commitment, and When to Buy