
GPU Cluster Monitoring: Metrics MLOps Teams Should Track
GPU clusters fail in patterns, and most of those patterns are visible in metrics hours before a job dies. The metrics that matter for MLOps teams fall into four groups: GPU-level health, job-level progress, node and network condition, and per-team usage. Tracking only utilization, the most common shortcut, misses memory leaks, thermal throttling, and inter-node contention that quietly slow training.
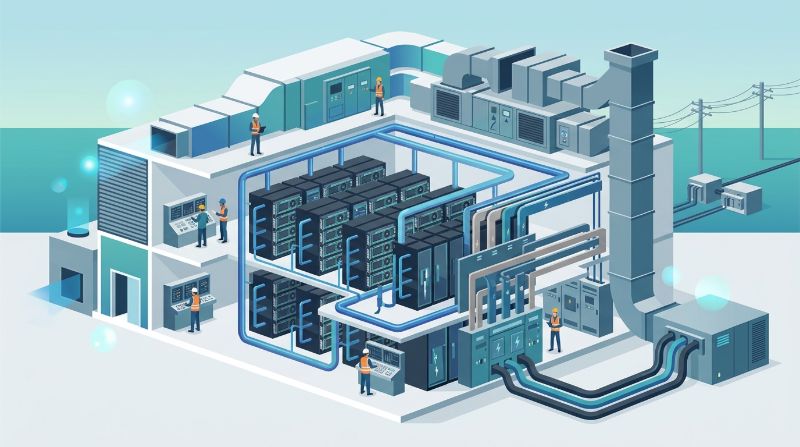
GPU cluster monitoring is the continuous collection and analysis of hardware, network, and workload metrics across all nodes in an AI cluster so that operations teams can detect failures early and use capacity efficiently. In an MLOps context, it extends to pipeline health, queue depth, and quota consumption.
This guide lists the metrics worth collecting, explains how MLOps-layer monitoring differs from IT infrastructure monitoring, and covers alerting practice and tooling choices for private GPU clusters.
What GPU Cluster Monitoring Covers
Monitoring scope is easier to design as layers than as one long metric list. The hardware layer answers whether each GPU and node is healthy. The workload layer answers whether jobs are progressing and using resources as expected. The platform layer answers whether the cluster as a whole serves its teams fairly, which includes queues, quotas, and historical usage.
Most teams already collect hardware metrics. The gap usually sits in the workload and platform layers, where the questions shift from component health to whether expensive GPU hours are producing useful training progress.
Core Metric Groups and Why They Matter
| Metric group | Representative metrics | Why it matters |
|---|---|---|
| GPU compute | SM utilization, occupancy, per-process usage | Low utilization signals data pipeline bottlenecks, not idle capacity |
| Memory | VRAM usage, memory bandwidth, allocation growth | Gradual growth predicts out-of-memory crashes before they happen |
| Thermals and power | Temperature, clock speed, power draw | Thermal throttling silently degrades throughput on dense nodes |
| Network | Inter-node bandwidth, retransmits, latency | Distributed training slows when collective communication degrades |
| Job health | Queue depth, step time, checkpoint success, error rates | Step-time drift often reveals contention earlier than loss curves |
| Team usage | Quota consumption, allocation history, fair-share balance | Turns GPU spend into an accountable internal service |
How MLOps Monitoring Differs from IT Infrastructure Monitoring
Traditional IT monitoring asks whether a server is up and responsive. MLOps monitoring asks whether a computation is converging, whether a GPU hour was well spent, and whether a model that served correctly yesterday still serves correctly today. Those questions need workload-aware metrics such as step time, checkpoint integrity, and inference latency distributions, not just CPU and disk counters.
The practical consequence is that MLOps monitoring must join two data sources: infrastructure telemetry from the cluster and experiment metadata from the training stack. When the two live in separate dashboards, teams lose time in every incident deciding which side to investigate first.
Alerting Practices That Reduce Noise
Alert quality decides whether monitoring helps or exhausts the team. Rules that hold up well on GPU clusters share a few properties:
- Alert on sustained deviation, not single spikes, because brief utilization dips during data loading are normal behavior.
- Pair every utilization alert with a memory or thermal reading, so on-call can triage cause and effect in one view.
- Alert on step-time and checkpoint failures directly, since these catch slow failures that uptime checks never see.
- Escalate quota exhaustion to capacity planners rather than engineers, because it is a planning signal, not an incident.
A useful review rhythm is monthly: keep alerts that predicted real incidents, and demote the ones that only generated chatter.
Common Failure Patterns the Metrics Should Catch
Four patterns account for most avoidable GPU cluster waste. Memory creep shows up as steadily growing VRAM allocation across steps and ends in a crash that loses hours of training. Thermal throttling appears as falling clock speeds while utilization stays high, so throughput drops without any obvious error. Network contention shows up as rising step time on multi-node jobs while single-GPU benchmarks stay normal. Finally, stranded allocations show up as GPUs reserved but running no useful work, usually after a scheduler policy or user error.
Each pattern is cheap to detect once the metric exists and expensive to debug when it does not. Teams adopting monitoring often start with these four detections before building anything more elaborate.
Tooling for Private and Dedicated Clusters
On private GPU infrastructure, teams can assemble monitoring from open-source telemetry components, but then own the integration, storage, and dashboard maintenance themselves. The alternative is a platform layer that ships observability with the cluster. For example, OnePlus Platform, the AI orchestration platform from OneSource Cloud, exposes GPU utilization, job history, and per-team usage metrics on private clusters so monitoring arrives integrated rather than assembled.
When evaluating either path, weigh the total operational load: collection agents, time-series storage, dashboard upkeep, and on-call familiarity. The right choice often follows team size, with smaller platform groups benefiting from integrated options such as managed AI infrastructure operations.
Platform Decision Matrix: Enterprise AI Cluster Orchestration
| Orchestration Model | Topology-Aware Scheduling | Preemption & Fair-Share Quotas | Enterprise Toolchain Integration | Infrastructure Operational Overhead |
|---|---|---|---|---|
| Vanilla Kubernetes / Default Scheduler | Basic node bin-packing; blind to NVLink / PCIe socket boundaries | Manual namespace quotas; prone to GPU allocation fragmentation | Native cloud-native container ecosystem | High manual YAML and operational complexity for AI teams |
| Legacy Slurm (Self-Managed) | Static topology maps; lacks cloud-native dynamic scaling | Rigid batch queueing; poor interactive notebook lifecycle control | HPC script-centric; decoupled from modern web/API inference | Heavy specialized Linux and HPC engineering maintenance |
| OnePlus™ Platform (OneSource Cloud) | Automated NVLink, NVSwitch, and RoCE topology-aware gang placement | Dynamic fair-share scheduling, automated notebook idle preemption | Non-disruptive dual integration with Slurm and Kubernetes workflows | Fully managed enterprise control plane on dedicated bare-metal |
To operationalize complex GPU environments without operational fragmentation, modern platforms integrate specialized AI management layers. Through the OnePlus™ AI Orchestration Platform by OneSource Cloud, enterprises deploy topology-aware gang scheduling that automatically detects physical NVLink, NVSwitch, and PCIe socket boundaries, placing distributed multi-GPU tasks exclusively within optimal hardware affinity domains. OnePlus coordinates multi-tenant project isolation, quota enforcement, automated notebook preemption, and failover rescheduling, transforming raw bare-metal GPU capacity into a shared, elastic enterprise AI service while preventing idle allocation waste.
FAQ
What GPU metrics should we monitor for machine learning workloads?
At minimum, collect SM utilization, VRAM usage and growth trend, temperature and clock speed, power draw, and inter-node network throughput for distributed jobs. Complement these with workload metrics such as step time, checkpoint success, and queue depth. Utilization alone is not enough, because several expensive failure modes, including memory leaks and thermal throttling, occur while utilization looks healthy.
How is GPU cluster monitoring different from server monitoring?
Server monitoring tracks component uptime and system load. GPU cluster monitoring additionally tracks workload economics: whether jobs progress, whether GPU hours are productive, and whether teams receive their allocated share. It also depends on accelerator-specific telemetry, such as VRAM allocation and thermal behavior, that generic server agents do not expose natively.
What causes slow training when GPU utilization looks normal?
Usually the data path or the network. Slow storage reads starve the GPUs, thermal throttling lowers clocks while utilization stays high, and inter-node network contention stretches collective operations in distributed training. Comparing step time against memory bandwidth, clock speed, and network retransmit metrics typically isolates the cause quickly.
Do we need monitoring if our cluster is managed by a provider?
Yes, but the scope changes. A provider operating the environment watches hardware health and platform availability, while your team still needs visibility into experiment progress, per-team usage, and cost accountability. Ask what per-team dashboards and export options the platform provides, because accountability metrics matter as much as uptime once multiple teams share capacity.
How should we track GPU usage across multiple teams?
Use quota accounting plus per-project usage history in a shared dashboard. Tie allocations to teams or projects, record consumption continuously rather than at billing time, and publish the summary internally. Platforms with built-in multi-team scheduling, such as OnePlus Platform, provide this view natively, which removes the reporting burden from engineers.
Summary
Effective GPU cluster monitoring pairs hardware telemetry with workload and team-level metrics, catches the four common waste patterns early, and keeps alert volume sustainable. Teams on private infrastructure choose between assembling the stack themselves and using an integrated platform layer. If monitoring overhead is already straining your platform group, review how OneSource Cloud delivers observability together with private AI infrastructure and managed operations.
Related Articles
Recommended Reading
-
How Paged Attention Manages Inference KV Cache
-
Google Cloud GPU Pricing: What Enterprise AI Teams Should Evaluate Before Provisioning
-
Paperspace Pricing 2026: GPU Cost Breakdown
-
AI Infrastructure Costs: Controlling Enterprise GPU Spending
-
CoreWeave Enterprise GPU Cloud: Evaluation for AI Teams
-
CoreWeave vs Lambda Labs: GPU Cloud Provider Comparison
-
AWS GPU Pricing: Instance Types, Cost Structure & Alternatives Guide
-
CoreWeave Alternatives: Compare GPU Clouds
latest articles
-
On-Premise AI Infrastructure vs Colocation vs Hosted Cloud
-
AI Orchestration Platform: How It Works on a Private GPU Cluster
-
Best GPU Cloud Hosting Providers: Why Rankings Differ and How to Build Yours
-
The Four Categories of Cloud Platforms for AI Workloads
-
RunPod Compared: How It Stacks Up Against Other AI Cloud Providers
-
Sovereign AI Cloud: Data Control for U.S. Enterprises
-
How to Choose a HIPAA-Compliant AI Infrastructure Provider
-
How to Build Private AI Infrastructure From Sizing to Operations
-
Lambda Labs Alternatives for Teams Outgrowing GPU Rental
-
GPU Cloud Computing: Comparing Bare Metal vs Virtualized vs Serverless Providers