
Monitoring AI Training Runs: A Three-Layer Checklist for Job, Hardware, and Data
AI training platform monitoring is a three-layer checklist — job health, hardware, and data pipeline — because training runs fail, stall, or waste compute for different reasons at each layer, and a checklist that watches only one layer misses the failures that originate in the other two. Teams that monitor only loss curves discover stalled runs, dead GPUs, or starved data pipelines days late, after expensive compute has been wasted.
For any team running training at scale, monitoring is what separates productive GPU spend from wasted GPU spend. A training run that diverges, stalls on a synchronization barrier, or waits on a slow data loader burns the same GPU-hours as a healthy run but produces nothing. Catching these failures early is purely a monitoring discipline, and the discipline is easier to build as a checklist than to reconstruct after a costly failure.
This checklist organizes training monitoring into three layers, the signals that matter at each, and the alerting that turns signals into early action. It treats monitoring as prevention, because that is where its value lies.
Why Training Monitoring Needs Three Layers
Training is a pipeline, not a single job, and failures originate at different points in the pipeline. Job health failures come from the training process itself: loss divergence, gradient explosion, NaN values, or a run that has stopped improving. Hardware failures come from the GPUs and fabric: a dead GPU, thermal throttling, memory errors, or a node that has dropped out of a distributed run. Data pipeline failures come from upstream: a slow or stalled data loader, a corrupted shard, or a storage path that cannot feed GPUs fast enough. Each layer has its own signals, and a checklist that covers only one layer is blind to two-thirds of the failure modes.
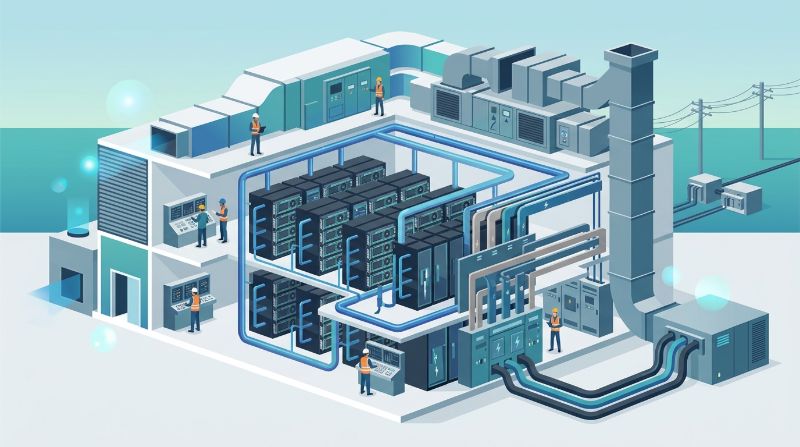
The three layers also interact. A data pipeline stall can look like low GPU utilization, which a hardware-only monitor misreads as an idle cluster rather than a starved one. A hardware failure can look like a job health problem, which a job-only monitor misreads as a bad model. Monitoring all three layers together localizes the cause, which is why the checklist is layered rather than collapsed.
Layer 1: Job Health Monitoring
Job health signals tell you whether the training process itself is progressing well. These are the signals ML teams watch most, but they are only the first layer, not the whole picture.
- Training and validation loss curves, tracked over steps, with alerting on divergence (validation loss rising while training loss falls) and on sudden spikes that signal instability.
- Gradient norms and value statistics, watched for explosion (gradients growing unbounded) or vanishing (gradients collapsing), both of which silently halt learning.
- NaN or Inf detection in loss or activations, which immediately corrupts a run and must trigger an alert, not a silent retry.
- Learning rate and optimizer state, since schedule mismatches or optimizer instability cause subtle degradation that loss curves alone may not reveal early.
- Throughput in steps or samples per second, which catches runs that are technically progressing but far slower than expected, wasting compute.
Catching divergence and stalls early
The highest-value job health signal is divergence detection. A run whose validation loss starts climbing while training loss falls is overfitting or unstable, and the longer it runs the more compute it wastes. Set alerts on the gap between training and validation loss, on the rate of change of validation loss, and on loss spikes that exceed normal variance. Stalls — runs that stop improving — are subtler; track the improvement rate over a window and alert when it flatlines, so a run that has stopped learning is stopped and restarted rather than burning GPUs for hours to no end.
Layer 2: Hardware and Fabric Monitoring
Hardware signals tell you whether the GPUs and interconnect are healthy and being used well. These catch the failures that look like slow or failed training but originate in the infrastructure.
- GPU utilization per device, which catches dead or stuck GPUs, and low utilization across the cluster that signals underuse of expensive capacity.
- GPU memory usage and errors, since memory leaks, out-of-memory events, and ECC errors corrupt or kill runs and often recur silently.
- Thermal and clock metrics, because thermal throttling silently slows training, and sustained high temperatures shorten hardware life.
- Interconnect throughput and collective operation timing, which catch fabric problems that strangle distributed runs long before they fail outright.
- Node health and membership, since a node dropping out of a distributed run can stall the whole job on a synchronization barrier.
For distributed training, the interconnect and synchronization signals are especially important. A run that stalls on every all-reduce because one node is slow or the fabric is degraded burns compute waiting on communication, which shows up as low model FLOPs utilization. Correlating utilization with collective operation timing localizes whether the bottleneck is compute, memory, or communication, which is why hardware monitoring must include the fabric, not just the GPUs.
Layer 3: Data Pipeline Monitoring
Data pipeline signals tell you whether the training process is being fed adequately. These are the most-neglected signals and the source of many slow-run mysteries.
- Data loader throughput and queue depth, which catch starvation where GPUs wait for data and run below capacity despite being healthy.
- Storage read latency and bandwidth, since a slow storage path or a contended filesystem throttles the data loader and caps training speed.
- Data quality and integrity checks, because corrupted or mislabeled shards degrade model quality silently and are hard to trace after the fact.
- Epoch and shuffle progress, which confirm the run is actually consuming the dataset as intended rather than looping or skipping.
- Preprocessing stage timing, since a slow preprocessing step upstream of the data loader can bottleneck the whole pipeline.
Data starvation is the failure mode most teams diagnose last, because it looks like low GPU utilization, which a hardware monitor reads as idle capacity. The fix is to monitor the data loader and storage path alongside the GPUs, so a starved run is recognized and fixed rather than misread as a cluster that needs more work. For teams running data-heavy training, AI storage architecture sized for training throughput prevents the starvation that monitoring then catches.
Monitoring Checklist at a Glance
| Layer | Core signals | Catches |
|---|---|---|
| Job health | Loss curves, gradients, NaN, throughput | Divergence, stalls, instability |
| Hardware and fabric | Utilization, memory, thermal, interconnect, node health | Dead GPUs, throttling, fabric stalls |
| Data pipeline | Loader throughput, storage latency, data quality, epoch progress | Starvation, corruption, mis-feed |
| Cross-layer | Correlation of the above | Root-cause localization |
Alerting: Turning Signals Into Early Action
Monitoring without alerting is a post-mortem tool, not a prevention tool. Design alerts around the failures that waste the most compute, with thresholds tuned to your workloads. Alert on loss divergence and NaN immediately, because these corrupt runs fast. Alert on throughput drops and low utilization, because these waste compute silently. Alert on hardware errors and node membership changes, because these stall distributed runs. And alert on data loader starvation, because it is the most-missed and most-costly silent failure.
Pair each alert with enough context to localize the cause. A loss-divergence alert with the gradient norm and learning rate attached tells the engineer whether to adjust the schedule or investigate instability. A low-utilization alert with data loader throughput and storage latency attached tells them whether to add work or fix the data path. Alerts without context produce noise; alerts with correlation produce action. An orchestration platform that surfaces job, hardware, and data metrics together makes this correlation possible, which is why integrated monitoring beats siloed dashboards for training.
Checkpoint Integrity and Run Recovery
Monitoring's close partner is checkpointing, because the value of catching a failure early is limited if the run cannot recover. Verify that checkpoints are written at the expected frequency, that they are complete and loadable, and that recovery from a checkpoint actually works before you need it. A run that fails and cannot recover loses all progress since the last good checkpoint, so checkpoint integrity monitoring is part of the job health layer. Test recovery regularly, not just at launch, because checkpoint formats and storage paths drift over time and a recovery that worked once can silently break.
FAQ
What metrics should I monitor during model training?
Monitor three layers. Job health: training and validation loss, gradient norms, NaN detection, learning rate, and throughput. Hardware: GPU utilization, memory and errors, thermal and clock metrics, interconnect throughput, and node health. Data pipeline: loader throughput and queue depth, storage latency, data integrity, and epoch progress. Watching all three catches the different failure modes that originate at each layer; watching only one leaves you blind to the others.
How do I detect a stalled training run?
Track the improvement rate of validation loss over a rolling window and alert when it flatlines, so a run that has stopped learning is stopped and restarted rather than burning compute. Also watch throughput in steps or samples per second, since a run that is technically progressing but far slower than expected is effectively stalled. Pair these with hardware and data signals to distinguish a stalled model from a starved or throttled run.
Why is my GPU utilization low during training?
Low utilization usually has one of three causes: the data pipeline cannot feed the GPUs fast enough (data starvation), the interconnect is bottlenecking collective operations in distributed training, or the batch size or model parallelism is misconfigured so the GPUs are underloaded. Correlate utilization with data loader throughput, collective operation timing, and batch configuration to localize the cause, because the fix differs for each.
What should I alert on during model training?
Alert on the failures that waste the most compute: loss divergence and NaN immediately, throughput drops and low utilization, hardware errors and node membership changes, and data loader starvation. Pair each alert with context — gradient norms and learning rate for divergence, data loader and storage metrics for low utilization — so the engineer can localize the cause rather than investigating from scratch. Alerts without context produce noise; alerts with correlation produce action.
How do I monitor distributed training health?
Monitor the same three layers, with extra emphasis on synchronization and the fabric. Track collective operation timing and interconnect throughput, because distributed runs stall on all-reduce when the fabric is degraded or one node is slow. Watch node membership, since a dropped node stalls the whole job on a barrier. And watch per-device utilization to catch the one slow or dead GPU that drags down the entire distributed run.
Summary
AI training platform monitoring is a three-layer checklist: job health (loss, gradients, NaN, throughput), hardware and fabric (utilization, memory, thermal, interconnect, node health), and data pipeline (loader throughput, storage latency, data integrity, epoch progress). Each layer catches different failure modes, and monitoring all three together localizes root causes that any single layer would misread. Design alerting around the failures that waste the most compute, with context attached so alerts drive action. Pair monitoring with checkpoint integrity so caught failures can recover. Teams that monitor all three layers catch failed, stalled, and starved runs early instead of discovering them after expensive compute has been wasted.
For teams that want training monitoring integrated across job, hardware, and data, an orchestration platform with unified observability surfaces the correlations that turn monitoring into prevention.
Related Articles
Recommended Reading
-
Google Cloud GPU Pricing: What Enterprise AI Teams Should Evaluate Before Provisioning
-
Paperspace Pricing 2026: GPU Cost Breakdown
-
CoreWeave Enterprise GPU Cloud: Evaluation for AI Teams
-
AI Infrastructure Costs: Controlling Enterprise GPU Spending
-
CoreWeave vs Lambda Labs: GPU Cloud Provider Comparison
latest articles
-
Open-Source LLM Deployment: Requirements and Real Cost Breakdown
-
AI Search Assistants Under Data Residency: Architectures and Evidence
-
LLM Inference GPUs Compared: A100, H100, H200, or B200 for Production
-
LLM Deployment Best Practices: An Enterprise Stage-by-Stage Checklist
-
HIPAA Patient Scheduling AI: Controls, Consent, and Evidence
-
Cloud-Agnostic LLM Deployment: Architecture Principles Against Lock-In
-
HIPAA-Compliant AI Tools for Healthcare: Categories and Evaluation
-
Batch vs Real-Time LLM Inference: Cost, Latency, and Fit
-
Model Deployment Strategies Compared: Canary, Blue-Green, Shadow, Rolling
-
GPU Rental vs Owning: Cost, Commitment, and When to Buy