
AI Storage Data Paths: How to Find Bottlenecks
An AI storage data path is the sequence of clients, caches, protocols, networks, storage tiers, and controls that data crosses before a model can use or persist it. For AI storage architecture data path, the decision starts with the actual workload and service outcome, then works backward through the controls in this article. Product labels and peak component specifications remain inputs until they are demonstrated in the intended operating path.
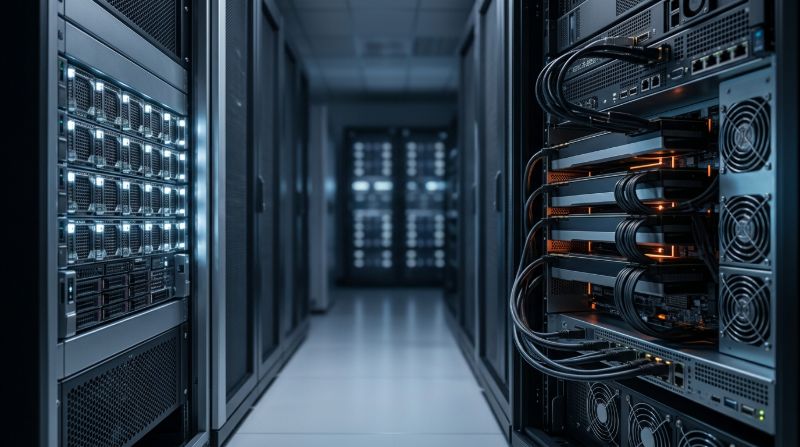
Storage incidents are often diagnosed from the array backward, even though the delay may begin in a client queue, container mount, metadata service, network hop, cache policy, or preprocessing stage. That narrow view prolongs GPU idle time and encourages expensive upgrades that do not remove the bottleneck. The practical response is to define the complete path, normalize responsibility, and test the proposed operating state with representative demand. That gives engineering, security, procurement, and finance a shared basis for approval.
AI Storage Data Paths: How to Find Bottlenecks Evaluation Framework
| Decision area | What to verify |
|---|---|
| Classify the operation | Separate model loading, dataset reads, checkpoint writes, retrieval, logs, snapshots, and restores because each has a different pattern. |
| Map every hop | Record the application, runtime, node, filesystem or object client, network, gateway, cache, and storage tier involved. |
| Align clocks | Use consistent timestamps and correlation identifiers so application, GPU, client, network, and storage events can be compared. |
| Measure queues | Inspect scheduler delay, application queues, outstanding I/O, network buffers, and storage queues instead of relying on utilization alone. |
| Check locality and cache | Distinguish cold and warm behavior and verify whether data placement matches the intended workload. |
| Reproduce safely | Create a representative test that changes one variable at a time while preserving the production-like path. |
Apply the framework to one shared baseline. In this case, the baseline must preserve application and model-load timestamps, client queue depth and I/O size, and network latency, loss, and retries. Proposals that cover different layers should be normalized before their cost, control, or operational risk is compared.
How to Validate the Decision
- Choose one user-visible symptom and a precise time window.
- Trace one representative request or job through every data-path hop.
- Correlate latency with queues, errors, retries, and GPU idle time.
- Form one bottleneck hypothesis and change only the relevant variable.
- Keep the before-and-after trace as an operational baseline.
The validation sequence moves from “Choose one user-visible symptom and a precise time window.” to “Keep the before-and-after trace as an operational baseline.” Each exception needs an owner and a retest trigger. That boundary is especially important when a model, traffic profile, platform release, or infrastructure topology changes after initial acceptance.
Critical Controls and Evidence
Classify the operation: Evidence Standard
Separate model loading, dataset reads, checkpoint writes, retrieval, logs, snapshots, and restores because each has a different pattern. For this decision, connect the result to application and model-load timestamps and client queue depth and I/O size. Record the workload condition, owner, threshold, and exception so the evidence remains comparable after a change.
Map every hop: Evidence Standard
Record the application, runtime, node, filesystem or object client, network, gateway, cache, and storage tier involved. For this decision, connect the result to client queue depth and I/O size and network latency, loss, and retries. Record the workload condition, owner, threshold, and exception so the evidence remains comparable after a change.
Align clocks: Evidence Standard
Use consistent timestamps and correlation identifiers so application, GPU, client, network, and storage events can be compared. For this decision, connect the result to network latency, loss, and retries and storage latency and metadata activity. Record the workload condition, owner, threshold, and exception so the evidence remains comparable after a change.
Measure queues: Evidence Standard
Inspect scheduler delay, application queues, outstanding I/O, network buffers, and storage queues instead of relying on utilization alone. For this decision, connect the result to storage latency and metadata activity and GPU idle and data-wait intervals. Record the workload condition, owner, threshold, and exception so the evidence remains comparable after a change.
Evidence pack for approval and later review
- application and model-load timestamps
- client queue depth and I/O size
- network latency, loss, and retries
- storage latency and metadata activity
- GPU idle and data-wait intervals
Store application and model-load timestamps and GPU idle and data-wait intervals with the exact hardware, software, configuration, workload profile, date, and reviewer. Separate measured results from estimates and name excluded paths. That record supports later architecture review, provider oversight, incident analysis, and capacity decisions.
Where OneSource Cloud Fits
For AI storage architecture data path, OneSource Cloud can connect AI Storage Architecture, High-Performance AI Networking, and Managed AI Infrastructure within one architecture-to-operations scope. The proposed fit should be tested with the article's workload profile, especially classify the operation, map every hop, and align clocks.
Dedicated capacity can make the relevant hardware, data, network, and administrative boundaries easier to document. Managed operations can own selected monitoring, incident, optimization, capacity, and lifecycle tasks. Customer governance remains necessary, so the service design should preserve a responsibility matrix and the evidence listed above.
FAQ
How do you identify an AI storage bottleneck?
Start with a specific service symptom, then trace the same operation across the application, client, network, cache, metadata, and storage layers. Align timestamps and compare queue depth, latency, retries, and GPU idle time. The bottleneck is the constrained stage that changes the service result when tested, not simply the busiest component.
What causes slow LLM model loading?
Common causes include large artifact size, cold caches, too many simultaneous replicas, metadata delay, constrained network paths, inefficient serialization, and slow container or registry access. Measure each stage of startup. Improving the storage array alone may not help if the delay occurs before the model artifact reaches it.
Should AI teams monitor average storage latency?
Average latency is useful but insufficient. Tail latency, operation type, client identity, concurrency, file size, and cache state often explain user-visible delays. Track percentiles and correlate them with model loading, checkpoint duration, request latency, and GPU idle time so the metric remains connected to an AI service outcome.
How often should the AI data path be retested?
Retest after significant model, dataset, runtime, network, storage, security, or topology changes. Also retest when team concurrency or backup behavior changes. A lightweight recurring baseline makes performance regressions easier to locate because the team can compare the same operation before and after the change.
Summary
AI Storage Data Paths: How to Find Bottlenecks becomes actionable when the team can choose one user-visible symptom and a precise time window. It should then trace one representative request or job through every data-path hop. and preserve GPU idle and data-wait intervals. This keeps the title's promise tied to a reviewable decision rather than a generic component list.
Next step: Use OneSource Cloud's private AI infrastructure architecture review to map workload, capacity, data, and operational requirements before procurement, migration, or production expansion.
Related Articles
Recommended Reading
-
How Paged Attention Manages Inference KV Cache
-
Google Cloud GPU Pricing: What Enterprise AI Teams Should Evaluate Before Provisioning
-
Paperspace Pricing 2026: GPU Cost Breakdown
-
AI Infrastructure Costs: Controlling Enterprise GPU Spending
-
CoreWeave Enterprise GPU Cloud: Evaluation for AI Teams
-
CoreWeave vs Lambda Labs: GPU Cloud Provider Comparison
-
AWS GPU Pricing: Instance Types, Cost Structure & Alternatives Guide
-
CoreWeave Alternatives: Compare GPU Clouds
latest articles
-
Which GPU Quote Terms Break at Renewal: Price and Capacity Fixes
-
Biotech GPU Computing Requirements: Genomics and Drug Discovery
-
Training Network Encryption: Requirements and Throughput Costs
-
GPU Depreciation Schedule and Monthly Cost at 3, 5, and 6 Years
-
Inference vs Training Storage Requirements for AI Clusters
-
GB200 NVL72 Rack Power Requirements for Facility Planning
-
How to Verify Data-Center GPU Firmware Measurement and Security
-
Why GPUs Stall on NFS During Training: Diagnosis and Fixes
-
GPU Driver and Firmware Pairing Without Deployment Delays
-
Measuring CUDA Graph Impact on LLM Inference Response Times